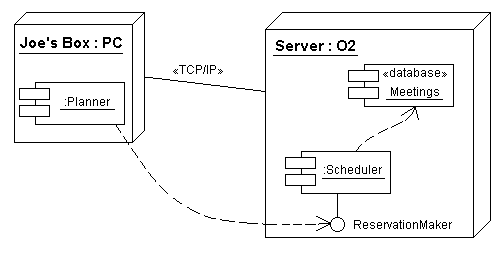
Deployment Diagrams
A deployment diagram shows the structure of the runtime system: the configuration of run-time processing elements and the software components, processes and objects that live on them.
A deployment diagram is a graph with
- Nodes
- Communication associations between nodes
- Run-time components that live on nodes
- Objects (active or passive) that live in components on the nodes
- Dependency associations where desired
Examples
Nodes
A node is a physical processing resource, such as a computer, printer, router, brake controller, etc. Nodes are just classes (or objects) with the stereotype «node» so you can use associations like generalization and aggregation (or links) between them.
Connections
Connections are stereotyped to show either a physical connection medium (e.g., fiber) or software protocol (e.g. TCP/IP).
Nesting of Components and Objects
Component instances on a deployment diagram are run-time entities, never source code entities (because the source code has been "compiled away"). But you can show components that exist at run time, such as web pages, images, and help files, of course. Show which components reside on which nodes by drawing them inside the node, or use aggregation or composition associations.
In general, instances can be located within other instances. For example an object can live inside a thread inside a process inside a component in some other component inside a node. Containment is shown by nesting, or by a property with tag “location.” Objects can have stereotypes such as «process» or «thread».
Migration
Components that migrate between nodes, or objects that migrate between components, are indicated by connecting instances of them with dashed arrows with the stereotype «becomes».
Other Relationships
You can show that a node is able to host a component by connecting the node to the component with a dashed arrow with the stereotype «supports».